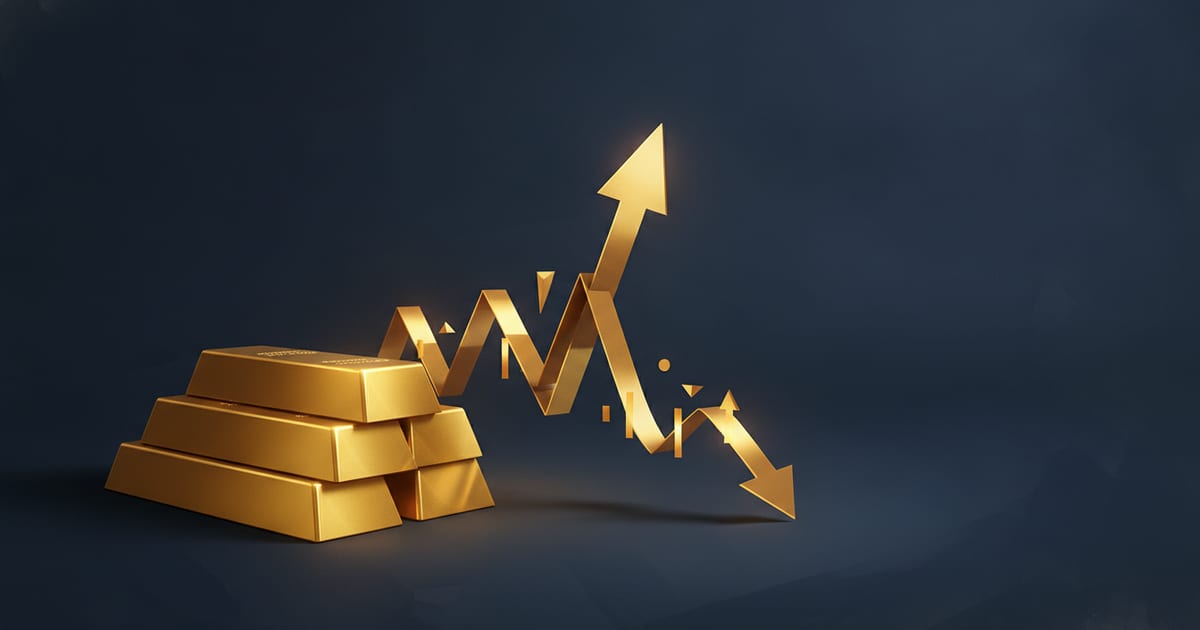
Against the headlines, gold did not climb through the first half of 2026 — it corrected. Our recorded data shows spot falling from $4,690.91 on May 6 to $4,066.20 on June 28, a 13.3% drop, while silver shed about 24% over the same window. Gold had set an all-time high near $5,589/oz on January 28, 2026 before the long pullback began. This page brings together the daily prices we have recorded since May 6, 2026, alongside the 2026 outlook from major institutions — the World Gold Council and the investment banks.
Key takeaways
- Gold trades near $4,066/oz, down 13.3% since May 6 and 10.5% over 30 days (DahabPulse; external sources put June 29 spot at ~$4,005–4,040 — Fortune).
- Our recorded high was $4,751.72 (May 11), our recorded low $3,996.16 (June 24).
- Silver fell about 24% ($77.35 → $58.78), faster than gold — gold/silver ratio near 69.
- Banks' year-end 2026 targets span $4,900 (Goldman) to $6,300 (Wells Fargo / J.P. Morgan), several cut recently.
- The Fed held rates at 3.50%–3.75% on June 17 and signalled a possible hike, not a cut (Federal Reserve).
- Central banks bought 244 tonnes in Q1 2026 (+3%) — a continuing structural support (World Gold Council).
- In Egypt, the goldsmith-dollar premium has narrowed to about +1% over the official rate.
What our data has recorded since May 2026
We record gold and silver closing prices daily since May 6, 2026. Across 54 days, this is measured movement, not prediction:
| Metric | Value | Source |
|---|
| Gold, May 6 → Jun 28 | $4,690.91 → $4,066.20 (−13.3%) | DahabPulse |
| 30-day change | −10.5% | DahabPulse |
| 7-day change | −2.2% | DahabPulse |
| Recorded high | $4,751.72 (May 11) | DahabPulse |
| Recorded low | $3,996.16 (Jun 24) | DahabPulse |
| Silver, May 6 → Jun 28 | $77.35 → $58.78 (−24.0%) | DahabPulse |
| Gold/silver ratio | ~69 | DahabPulse |
Our window starts near a local peak (May 11), so the "since-start" figure looks sharper than the 30-day move. These are recorded spot prices, not averages.
How far from the peak?
| Event | Price | Date | Source |
|---|
| All-time high | ~$5,589 | Jan 28, 2026 | Investing News Network |
| LBMA Q1 average | $4,873 | Q1 2026 | World Gold Council |
| Our recorded high | $4,751.72 | May 11, 2026 | DahabPulse |
| Our recorded low | $3,996.16 | Jun 24, 2026 | DahabPulse |
| Current | ~$4,066 | Jun 28, 2026 | DahabPulse |
Gold is about 27% below its January peak but still ~21% above its level a year ago ($3,314 in June 2025 — Fortune). 2026 is a correction within a longer uptrend, not a collapse. Gold slipped below $5,000 on Jan 30 and under $4,400 in early February, then settled into the corrective range that spans our recording window.
Gold prices by country (21K)
The dollar move carries into local currencies at similar rates across the dollar-pegged Gulf, while Egypt differs because the pound moved:
| Country | 21K (May 6) | 21K (Jun 28) | Change |
|---|
| UAE | AED 484.64 | AED 420.10 | −13.3% |
| Saudi Arabia | SAR 494.87 | SAR 428.96 | −13.3% |
| Egypt | EGP 7,085.96 | EGP 5,666.53 | −20.0% |
| Qatar | QAR 480.35 | QAR 416.38 | −13.3% |
| Kuwait | KWD 40.63 | KWD 35.37 | −13.0% |
| Oman | OMR 50.74 | OMR 43.98 | −13.3% |
| Bahrain | BHD 49.62 | BHD 43.01 | −13.3% |
Egypt's larger drop (−20%) is twofold: the global gold fall plus the pound strengthening ~7.8% against the dollar over the window (from 53.70 to 49.54 per USD in our data). See the gold price trends page.
What institutions forecast for the rest of 2026
We publish no price target of our own; here is what the reference institutions say. The tone is structurally bullish but with recent target cuts after the first-half correction:
| Institution | Year-end 2026 target | Direction | Source |
|---|
| Goldman Sachs | $4,900 | cut from $5,400 | via GoldSilver |
| Morgan Stanley | $5,200 (bull) / $4,400 (base) | cut from $5,700 | TheStreet |
| UBS | $5,500 | cut from $5,900 | Kitco |
| J.P. Morgan | ~$6,000 (Q4 average) | 2026 avg trimmed to ~$5,243 | J.P. Morgan |
| Bank of America | $6,000 (12-month) | maintained | Kitco |
| Wells Fargo | $6,100–$6,300 | raised from $4,500–$4,700 | Reuters |
The consensus year-end range is $4,900–$6,300, above current — but note Goldman (the low) cut its target, and Morgan Stanley's base case ($4,400) sits near today's market. Forecasts are not promises.
What is moving gold in 2026
| Factor | Current state | Effect on gold | Source |
|---|
| Fed funds rate | 3.50%–3.75% (held Jun 17) | Headwind (no cut expected) | Federal Reserve |
| 10-year real yield | ~2.17% | Headwind (higher opportunity cost) | Trading Economics |
| US Dollar Index (DXY) | ~101.3 (+4.6% YoY) | Headwind (strong dollar) | Trading Economics |
| Central-bank buying | 244t in Q1 (+3%) | Structural support | World Gold Council |
| Geopolitics | Middle East / Strait of Hormuz | Support (safe-haven demand) | Federal Reserve statement |
A balanced picture: headwinds from rates and the dollar, support from central-bank buying and safe-haven demand. That tug-of-war explains a first-half correction without a collapse.
Egypt: the goldsmith dollar and the pound
Egypt's local price tracks the "goldsmith dollar" — the implied USD/EGP rate derived from local gold-gram prices. The key 2026 development: the gap between the parallel market and the official rate has all but closed.
| Metric | Value | Source |
|---|
| Goldsmith dollar | ≈ EGP 50.05/USD | DahabPulse feed |
| Official rate | ≈ EGP 49.5 | Central Bank of Egypt |
| Premium | ~+1% only | Calculated |
| 2026 USD/EGP range | 46.69 (Feb 17) – 54.69 (Apr 8) | Wise |
The pound is down ~3% YTD but recovered from its April peak (54.69), so the currency's effect on local gold prices is now close to its global effect. Run the cost for your karat in the gold calculator and the Egypt gold page.
Gold by the numbers (2026) — summary
| Metric | Value | Source |
|---|
| Current gold price | ~$4,066/oz | DahabPulse |
| Change since May 6 | −13.3% | DahabPulse |
| 30-day change | −10.5% | DahabPulse |
| Recorded high | $4,751.72 (May 11) | DahabPulse |
| Recorded low | $3,996.16 (Jun 24) | DahabPulse |
| 2026 all-time high | ~$5,589 (Jan 28) | Investing News Network |
| Gold YoY change | +~21% | Fortune |
| Silver price | ~$58.78 (−24%) | DahabPulse |
| Gold/silver ratio | ~69 | DahabPulse |
| Q1 gold demand | 1,231t (+2%) | World Gold Council |
| Q1 central-bank buying | 244t (+3%) | World Gold Council |
| 2026 CB buying outlook | 700–900t | World Gold Council |
| Fed funds rate | 3.50%–3.75% (Jun 17) | Federal Reserve |
| 10-year real yield | ~2.17% | Trading Economics |
| US Dollar Index | ~101.3 | Trading Economics |
| Bank year-end target range | $4,900–$6,300 | Banks above |
| Egypt goldsmith dollar | ≈ EGP 50.05 | DahabPulse |
FAQ
Will gold fall further in 2026?
No one can guarantee direction. Our data shows a 13% correction since May, and the headwinds (higher rates, a strong dollar) remain; against that, banks see higher levels by year-end ($4,900–$6,300), supported by central-bank buying. The decision depends on your time horizon, not on timing an entry point.
When did gold hit its highest price?
Gold reached an all-time high near $5,589/oz on January 28, 2026, then began correcting (Investing News Network).
What do banks forecast for gold in 2026?
Year-end targets range from $4,900 (Goldman) to $6,300 (Wells Fargo and J.P. Morgan), with several banks cutting their targets after the first-half correction.
Is it a good time to buy gold?
It depends on your goal: long-term buyers look at the structural support (central-bank buying), while higher rates and a strong dollar are near-term pressures. If you are buying for zakat or savings, calculate the real cost for your karat in the gold calculator first.
How much is gold in Egypt today?
The price changes daily; see the Egypt gold page for the updated 24K/21K/18K price at the goldsmith dollar.
Methodology and sources
- Our data: spot closing prices for gold and silver recorded daily since May 6, 2026; local prices converted at each day's recorded exchange rate (Egypt at the official rate in historical series). 21K = spot ÷ 31.1035 × 0.875.
- External sources: World Gold Council (Gold Demand Trends Q1 2026), US Federal Reserve (June 17, 2026 statement), Trading Economics, Fortune, Investing News Network, and bank notes (Goldman Sachs, UBS, J.P. Morgan, Bank of America, Wells Fargo, Morgan Stanley).
- Last updated: June 29, 2026. We refresh these figures periodically.